You Focus on Your Future. We’ll Focus on Your Finances.TM
Fee-only, comprehensive wealth management for all generations.
Bedel Blog
Accidents Happen: Are you covered?
Many times, umbrella coverage is overlooked. Unlike homeowner, auto, and health insurance,...
Easing Like Sunday Morning
Since they last raised rates in July 2023, the Fed has kept rates at their current level while...
Finally! Final Regulations for Inherited IRAs
Since the SECURE Act became law, Inherited IRAs have become exceedingly more complicated. The...
The Small-Cap Stock Resurgence
Investors who prioritize diversification and maintain a long-term perspective are better equipped...
GenNeXt Blog
Where Are You Putting All That Cash?
With the Federal Reserve’s rapid interest rate increases, more options exist for your cash to...
Instant Gratification? Not So Fast
It’s easy to opt for instant gratification when it comes to financial decisions. It feels good to...
The Lost Years: The Untold Truth About Your 30s
What people fail to talk about is how this phase of life is expensive and can easily throw a...
Important 529 Plan Changes
Any Indiana resident contributing to a CollegeChoice 529 plan is eligible for a refundable state...
BEDEL BAROMETER
Last updated September 2024
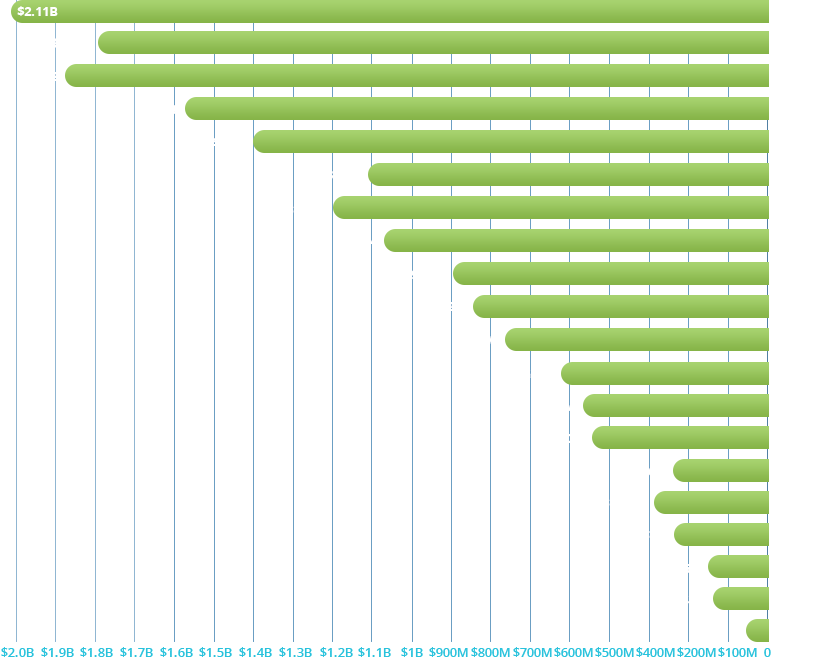
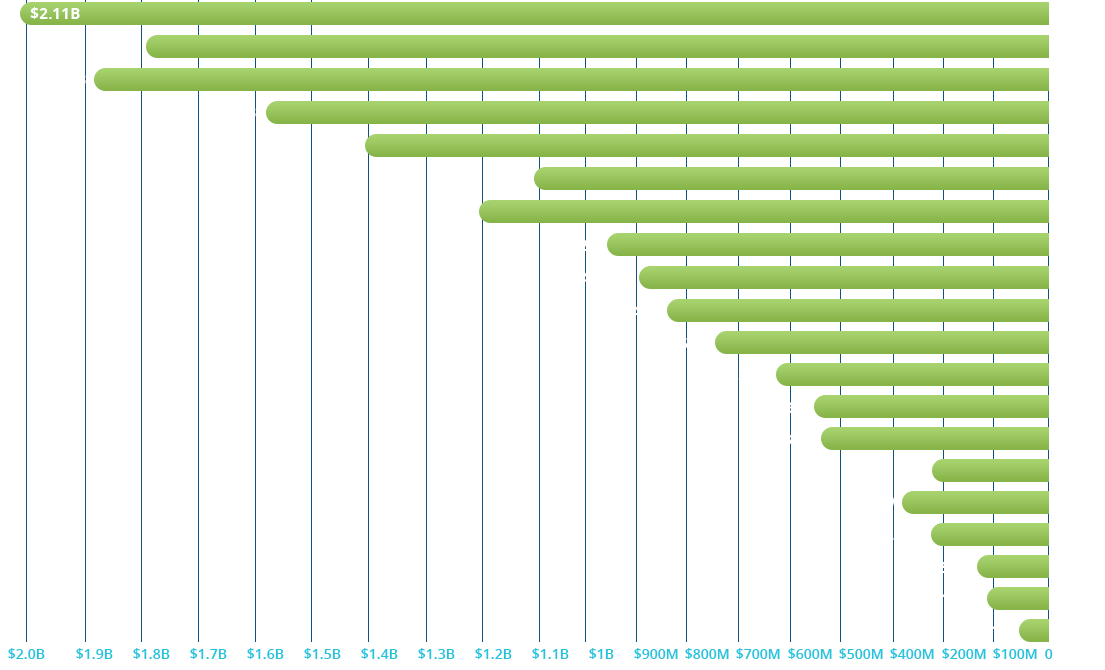
BEDEL FINANCIAL GROWTH BY CLIENT INVESTMENT ASSETS
(DISCRETIONARY ASSETS UNDER MANAGEMENT)


Values as of December 31st of each year

